Ever taken a quick look at old charts and wondered what they could tell you about where the market might go next? Technical analysis reviews historical price data, like candlestick charts (simple visual tools that show price swings) and bar charts, to identify repeating patterns. These patterns give you hints about whether buyers or sellers are in control.
By spotting these trends, you can better guide your trading moves. It’s surprising how clues from past market behavior can sharpen your insight into future trends.
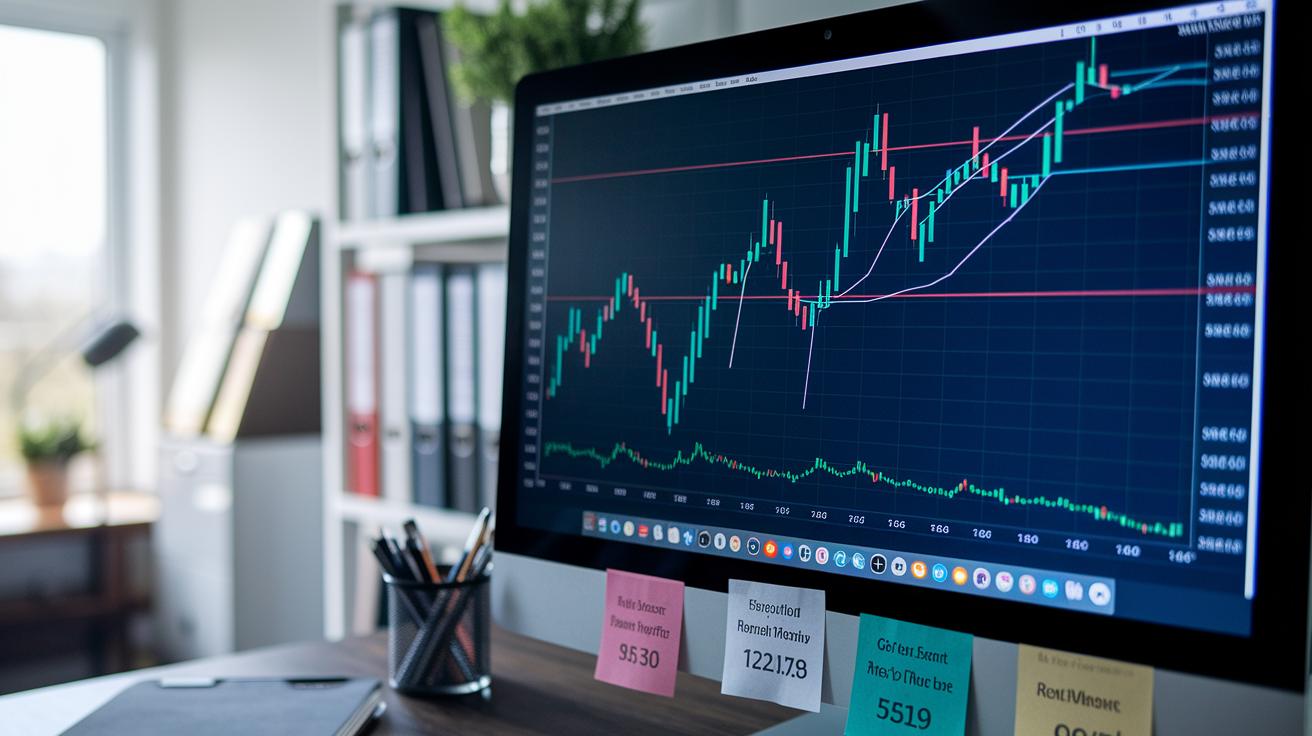
Core Technical Analysis Methods for Predicting Market Trends

Technical analysis helps us guess where markets might go by looking at past price charts and data. It’s based on the idea that old price moves, whether shown on a line, bar, or candlestick chart, can hint at future trends. Ever looked at a candlestick chart? Each candle gives you a clear picture of price moves over one hour, showing what buyers and sellers are doing.
Many traders use this method because market patterns often repeat, they act in ways you can almost predict. When you spot recurring support and resistance levels, these clues can hint at new trends beginning. Shorter time frames can show quick price jumps, while longer views smooth things out to reveal bigger trends.
Some common price action methods include:
- Line charts: These show only the closing prices, giving you a simple look at the trend.
- Bar charts: These display the full range of price movement during a session.
- Candlestick charts: They give more details by showing the open, high, low, and close prices, which helps you see the mood of the market.
Traders study charts over different time frames, daily, hourly, or even minute-by-minute, to check if the trend is strong or if a reversal might be coming.
But remember, no single tool is foolproof. It’s important to use solid risk controls like stop-loss orders and careful position sizing to handle sudden changes in the market. By mixing historical price insights with cautious risk management, traders build strategies that can weather volatile market moments.
Reading and Interpreting Price Charts in Technical Analysis
We already talked about simple chart types, but now let's dig into some advanced tricks that can really boost your skills. Candlestick charts show careful signals. Ever seen a doji pattern? It’s like the market takes a tiny pause, hinting it might change direction. Other shapes, like the hammer or shooting star, also point to possible shifts.
Advanced ideas include checking charts over different time frames. Look at a daily chart to catch the big picture, then zoom into an hourly chart to nail down your entry spot. For example, if you spot a hammer on a 4‑hour chart that lines up with a strong support area on the daily chart, it might signal a turning point.
- Line chart focuses on the closing price.
- Bar chart shows the full price range.
- Candlestick charts reveal pattern clues and clear trends.
Picture this: A trader noticed a doji on a 15-minute chart right where there was support on an hourly chart. That match was a clear call to act, showing just how powerful it is to check different time frames for spotting market opportunities.
Key Indicators for Technical Analysis of Financial Markets

Technical indicators are like simple tools that help traders figure out market patterns and signals. They come in different categories that each focus on a specific piece of price data. For example, moving averages gently smooth out price bumps to show the main trend, often using 50-day or 200-day averages. MACD checks the gap between fast and slow exponential moving averages (EMAs, which are moving averages that give more weight to recent prices) to highlight shifts in momentum. Oscillators such as the RSI alert you when a market might be too high or too low, hinting that a reversal could be coming. Bollinger Bands plot channels around a moving average using standard deviations to show just how wild the market is. And volume indicators add extra proof by confirming the force behind price changes.
| Indicator | Purpose | Typical Settings |
|---|---|---|
| Moving Average | Smoothing out trends | 50, 200 periods |
| MACD | Checking momentum | 12, 26, 9 EMAs |
| RSI | Finding overbought/oversold | 14 periods |
| Bollinger Bands | Measuring volatility | 20 MA ±2 SD |
Mixing these indicators together can either confirm a steady trend or warn you when the market is about to change direction. For instance, if your chart shows a moving average crossover, a MACD shift, and a falling RSI moving away from overbought territory, these combined signs might boost your confidence in expecting a reversal. On the other hand, when Bollinger Bands tighten and volume goes up, it could mean a strong new price move is coming. Many traders turn to platforms that bundle these technical tools, like best technical analysis software, to see even more clearly what’s going on. Often, using several indicators together and tweaking your risk settings based on them gives a much stronger snapshot of where the market may head next.
Pattern Recognition Techniques in Technical Market Analysis

Head and Shoulders Pattern Detection
This pattern is a strong sign that the trend might be flipping. It starts with a left shoulder, where prices hit a moderate high. Then, the price climbs to a higher peak called the head, and finally, it falls to create a right shoulder. Traders really watch the neckline, a line joining the lows of the left shoulder and the head, as a support level. When the price drops below this line, it could mean that selling pressure is mounting. Picture a candlestick chart where you see a bullish engulfing pattern (a signal of strong buying) during the head, and then the price slips underneath the neckline; that change often confirms a reversal.
Double Top Reversal Patterns
Double top patterns show two clear peaks at about the same level, which means the market is pushing back against higher prices. Often, trading volume drops while these peaks form, but a sudden burst of volume along with a break below the connecting line of the two lows (the neckline) confirms the pattern. Imagine two doji candles forming near the same high level, suggesting that buyers are running out of steam. When prices fall past the line that links the two bottoms, it’s a clear cue to take action. Timing is key, consider entering a trade when the price clearly falls below the neckline, and use stop-loss orders placed just above the right shoulder or the second peak to protect your position if the pattern doesn’t fully develop.
Applying Technical Analysis Across Stocks, Forex, and Futures

Price charts are like windows that clear up any market you look at. They work the same whether you’re eyeing stocks, currencies, commodities, or crypto. Technical analysis stems from watching past price moves and patterns that have helped traders, whether they’re working within a day, over several days, or using computer models (algorithmic models).
When you trade intraday, you need fast, clear signals to make quick moves. Imagine a busy forex market where every minute counts, a tiny price change might open a huge chance if you’re tuned in. On the flip side, longer swing strategies use extended time periods to catch broader trends and slow, steady reversals. These ideas fit well with stocks and futures, where trends can take days or even weeks to form.
Futures trading throws in its own twists, like rollover periods when trading contracts change. At these times, traders tweak their plans to handle small timing gaps and shifts in market liquidity. And with forex, it’s all about the fast pace. Tools like moving averages (smooth lines that average out price moves) and oscillators (indicators that show if an asset might be overbought or oversold) help clear the fog.
Bringing these insights together can really boost a trader’s game. For example, if you see the same chart pattern in both stocks and currencies, it’s like a double-check on your signal. Studies that look at different markets together give you a wider view, making trend spotting more reliable. By mixing different time frames and respecting each market’s quirks, technical analysis turns into a trusted method for catching those sharp trend signals in stocks, forex, and futures.
Risk Management Strategies in Technical Analysis of Financial Markets

Traders know that no one signal is perfect. Sometimes, mixed signals or sudden events can turn what looked like a winning trade into a risk. Smart traders protect their money using risk management tips. One simple example is the stop-loss order, which is set at a specific price so that if the market goes the wrong way, the trade is closed automatically. For example, a trader might put a stop-loss order just a bit below a recent support level, so if prices drop, the loss stays small.
Another key idea is to choose your trade size based on the risk you’re willing to take. By using only a small, fixed slice of your overall money on each trade, you keep losses small if the market turns against you. Measuring how wild the market is, like using the average true range (ATR) which tells you the average price swing, can also help. When the ATR is high, traders might use wider stops, but when the market is calm, they can set tighter stops.
Traders also need to pay close attention to their signals. If a technical indicator begins to suggest that the trend might be changing, it might be best to exit the trade early. By combining stop-loss orders, careful trade sizing, and adjustments based on market movement, traders build a solid defense against quick market shifts while keeping their main focus on protecting their money.
Selecting and Integrating Technical Analysis Tools and Software

Picking the right platform can make a big difference in your trading. Today's tools use technical indicators (simple signals based on past price movements) to guide everyday decisions. Find software that lets you set up your own indicators so you can match your trading style. Imagine getting an alert that says, "Trading signal activated when the moving average crossover happens" – it's like having a friend give you a heads up when the market shifts.
Some platforms let you see charts for an hour, a day, and even a week all at once. Automated alerts mean you don’t have to watch your screen every minute. And if the system includes backtesting (checking how a strategy would have done in the past), you can feel more certain before you act.
Real-time data feeds keep your charts fresh and in tune with the current market buzz. Plus, automated chart screening quickly finds the setups that match your rules, saving you time. Try a few different platforms to see which one fits your trading habits and technical analysis needs best.
Final Words
In the action, our guide showed how reading price charts, identifying trend patterns, and applying clear risk controls can sharpen your trading skills.
We touched on techniques like candlestick insights, multi-timeframe reviews, and the role of indicators in reinforcing trade decisions.
This blog post offers practical ideas and hands-on tools for mastering advanced techniques. By embracing technical analysis of financial markets, you can build confidence and fine-tune your approach. Keep exploring and enjoy refining your strategies every step of the way.
FAQ
What does “Technical Analysis of Financial Markets PDF” refer to?
The term refers to a digital version of John Murphy’s book that details chart reading, trends, and key price indicators for forecasting financial market movements.
How can I access the Technical Analysis of Financial Markets book by John Murphy?
You can obtain legal copies from reputable online retailers, academic sites, or official publishers. Always verify the source to avoid unsupported downloads.
Is there a review of Technical Analysis of Financial Markets by John Murphy?
Reviews typically explain the book’s practical methods for predicting market trends and discuss its use of charts and indicators, providing clear insights on its educational value.
Can I get the latest edition of Technical Analysis of Financial Markets PDF?
The latest edition is available through updated online stores and libraries. Verify that you are downloading the current version from a trusted source.
Is a free audiobook download version of Technical Analysis of Financial Markets available?
Audiobook versions may exist, but free downloads are rare. Check legitimate platforms or streaming services that offer samples to ensure quality and legal access.

