Are we about to see another market drop? Recent news shows that most AI investors (people putting money into smart tech) are still waiting for gains. It feels like a runner frozen at the starting line, unsure of when to start.
But even though a sudden fall can shock us, it can also open the door for growth and new chances. This mix of worry and hope might be the sign of a fresh turn for anyone watching the market closely.
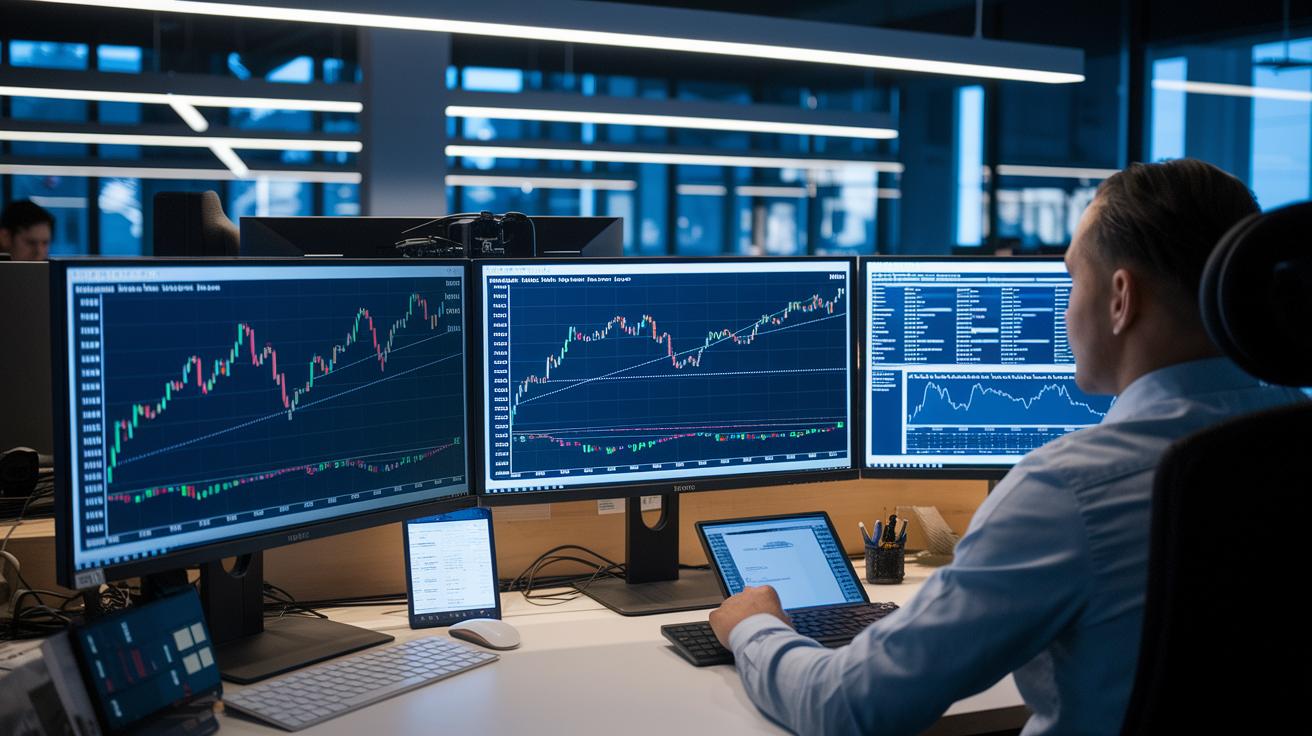
Will We See a Stock Market Crash Soon?
Lately, market talk has turned to a worrisome sign. A recent MIT report showed that 95% of AI investors haven’t seen any returns on their investments yet, sparking fears of a tech bubble. Comments from Sam Altman only added to the concern, and soon after, we saw markets take a noticeable dip.
Imagine a runner hesitating at the starting line because of a nagging doubt. Consider this eye-opening fact: out of every 100 businesses betting on AI, 95 are still waiting for gains. This reality shows just how unsure investors feel, like clouds gathering before a storm.
Today’s investor mood is similar to that calm before a heavy downpour. Traders and analysts compare the current jitters to past moments when uncertainty quickly turned into full-blown market crashes. It’s a sign that many are treading carefully, waiting for clearer signals before they make their next bold move.
Historical Crash Comparisons for Today's Market

Looking back, tough stock market crashes give us clues about today’s ups and downs. In 1929, the market lost nearly 89% of the DJIA’s value over a couple of years. Then on Black Monday in 1987, the S&P dropped over 22% in just one day. And in 2000, the NASDAQ fell roughly 78% over two years. Each of these falls hit hard and recovered in their own way.
| Year | Index | Peak-to-Trough Decline |
|---|---|---|
| 1929 | DJIA | ~89% |
| 1987 | S&P | 22.6% |
| 2000 | NASDAQ | ~78% |
| 2008 | S&P | ~57% |
| 2020 | S&P | ~34% |
These historical moments give us a hint that even big crashes can lead to eventual recoveries. Many investors remember that when the market falls hard, it often sets the stage for future growth. Today’s market chatter mixed with lessons from the past suggests that while it’s smart to be cautious, there could also be great opportunities to build a stronger, more solid financial foundation.
Economic Warning Signals and Key Indicators
Many experts keep an eye on a few clear signals when they worry about a market drop. They watch changes in interest rates, job numbers, and other key numbers that have warned of trouble in the past. For example, a yield-curve inversion (when short-term rates go above long-term rates) gave a 12- to 18-month heads-up before the recessions in 2000 and 2008. Sudden jumps in credit spreads and shifts in job figures also play a big role in the stress tests investors run during uncertain times.
- Yield-Curve Inversion: This is when short-term interest rates top long-term ones, hinting at a slowdown.
- Credit Spreads Widening: In earlier downturns, spreads hit around 600 basis points, signaling rising risk.
- Low Unemployment Figures: An unemployment rate below 4% has often appeared just before a collapse.
- Fed Rate Hikes: Increases, like those seen in 2022, have frequently led to more market volatility.
- GDP and Inflation Trends: Changes in overall growth and rising prices point to economic stress.
These signals remind us to stay alert. By watching these markers, yield-curve inversions, widening credit spreads, and abrupt shifts in employment or policy, investors try to predict the next downturn. Keeping an eye on these five top cues helps market players adjust their positions and brace for possible changes in the financial landscape.
is a stock market crash coming: Hope Ahead
Technical analysis gives us clear signs even as the market mood shifts. Back in March 2020, the VIX jumped to 37.3, a strong reminder of how fast things can change. I remember watching the 50-day/200-day moving average crossovers during earlier downturns, like the tech slump in 2000, which signaled that reversal might be on the way. Even when Bollinger Bands show about a 2% deviation on the S&P, it points to hidden instability under tight price ranges. Today, as moving averages draw closer together, traders are honing in on the subtle hints from index volatility and trend momentum. These visual cues not only track the speed of market moves but also fine-tune models that help many decide on smarter trading actions.
Let’s break down four key technical signals we keep an eye on:
- VIX levels: When it goes above 35, it's a call for caution.
- 50/200 moving average crossovers: They historically hint at shifts in momentum.
- Bollinger Bands deviations: About a 2% shift often means prices are tightening.
- Moving average divergence: When it narrows, it can mean the trend is changing.
| Indicator | Threshold | Implication |
|---|---|---|
| VIX | >35 | Higher market fear |
| 50/200 MA Crossover | Crossover Event | Possible trend reversal |
| Bollinger Bands | ~2% deviation | Prices compressing, hinting at a build-up |
| MA Divergence | Narrowing | Shift in trend momentum |
Systemic Risk Evaluation and Financial System Instability
Recent policy blunders have made our economic system more fragile. Tariffs bumped up supply-chain costs by 10% (that’s the extra money needed to move products from factories to stores), squeezing industries that are already working with tiny profit margins. Political deadlock delayed helpful stimulus measures, leaving us without quick fixes. Meanwhile, heavy investments in the AI bubble (a period when money flows into artificial intelligence projects without clear returns) add to the tension. All these factors mix together, making the financial system feel unstable and in need of stronger shock-absorbing measures.
Debt is another big worry. The U.S. Debt-to-GDP ratio now stands at 130% – a sign that the government’s debt is very high compared to the size of our economy. This high debt level spreads uncertainty across the market and makes the system more vulnerable, especially when borrowing costs rise and fiscal policies tighten. Investors and policymakers are watching this number closely, knowing that constant high debt can erode market confidence and start a chain reaction of issues. In short, keeping an eye on these debt metrics is crucial for understanding systemic risk.
Global risks make the picture even more complex. Domestic policy missteps, mounting debt, and the ongoing stress from AI investments all combine to create a situation where one problem can lead to another. Experts say that trouble in one region can quickly spread, impacting trade partners and financial markets around the world. This means that instability in one area might soon trigger wider market disturbances. By watching these stress indicators, analysts can better understand if these weaknesses might lead to longer spells of financial instability.
Expert Opinions and Crash Prediction Models

Analysts rely on smart tools like logistic regression (a way to use past data to predict future risks) and GARCH (a method that checks past market ups and downs) to get a grip on market risks. For example, logistic regression looks at old trends and figures there’s about a 25% chance of a crash in the next year. GARCH works in a similar way by tracking changes in market activity, letting traders see risk levels more clearly.
Then, institutions like MIT run stress test simulations to see how the market might act under heavy pressure. In these tough scenarios, predictions show that the S&P could drop by as much as 30%. Mixing these steady techniques with intense simulation tests gives us a clearer picture of what could happen when the market feels the heat.
Breakdown:
- Logistic Regression Models – Analyze historical data to suggest roughly a 25% crash chance in 12 months.
- GARCH Models – Keep an eye on market fluctuations to help forecast potential downturns.
- Stress Test Simulations – Under severe conditions, these point to the S&P possibly losing up to 30%, highlighting big risks.
Portfolio Risk Management and Survival Strategies
When markets get rough, you have to protect your investments. Picture your portfolio as a boat that needs extra weight to stay steady in stormy seas. For example, investing about 20% in bonds or gold (bonds are loans you give to companies or governments; gold is a valuable metal) has helped lower losses by around 15%.
Many investors found that a balanced mix, say 60% stocks and 40% bonds (stocks are shares in companies), kept losses smaller during the 2008 crash. Even hedged funds (investment funds using special strategies to reduce risk) managed to earn about 8% during the 2022 drop. These choices work like a safety net, or like having a tool kit ready to fix things fast. For example, a stop-loss order (a command that sells a stock automatically if it falls to a certain price) helps stop a small dip from turning into a big fall.
Taking charge means planning ahead and keeping a close eye on your risks. Along with mixing your investments wisely, use safe investing tips that protect each part of your portfolio. Watch market signals and use tools like market trend analysis (a way to see where the market is going) to decide when to adjust your investments. It doesn’t matter if you’re new at this or experienced, a solid plan can bring extra comfort during tough times.
- Asset allocation: Spreading your money across different investments to lower risk.
- Stop-loss orders: Automatically selling stocks when prices drop sharply to keep losses small.
- Hedging: Using other financial tools to help lessen possible losses.
- Diversification: Investing in various sectors and asset types to balance risk.
- Cash reserves: Keeping available cash to grab opportunities or cover sudden needs.
- Inverse ETFs: Using funds that move opposite to market trends to add extra protection.
Final Words
In the action, our analysis shed light on early AI bubble insights, historical crash comparisons, key economic signals, and technical trends. We weighed expert models and risk management strategies that help guard your investments. Each part of the discussion aimed to simplify complex topics and sharpen your hands-on trading approach. Is a stock market crash coming? While the signals vary, smart traders use these tools to stay prepared. Keep learning and refining your strategy, the market’s energy invites you to stay ahead with confidence.
FAQ
Is a stock market crash coming soon?
The question on whether a market crash is coming soon is met with mixed signals. Expert sentiment and key risk indicators advise caution, yet no one can pinpoint a specific day.
What are the stock market forecasts for the next 6 months and next 5 years?
The question regarding both short- and long-term forecasts shows that while near-term volatility is possible, returns over five years will depend on shifting economic conditions and investor sentiment.
Should I pull my money out of the stock market?
The question about withdrawing investments suggests that a sudden exit might not be wise. Most experts favor a well-diversified approach based on personal risk tolerance.
What are the odds of a stock market crash?
The question on the likelihood of a crash is answered by various economic models. These models indicate a modest chance, yet uncertainty remains due to changing market factors.
What is Warren Buffett saying about the stock market?
The question about Buffett’s views shows he advocates for a long-term focus on market fundamentals and a measured, well-informed investment strategy over reacting to short-term swings.
What does the 7% rule in stocks mean?
The question on the 7% rule typically refers to an average annual return expectation for stocks. This rule is a rough guide, and actual returns can vary with market conditions.

