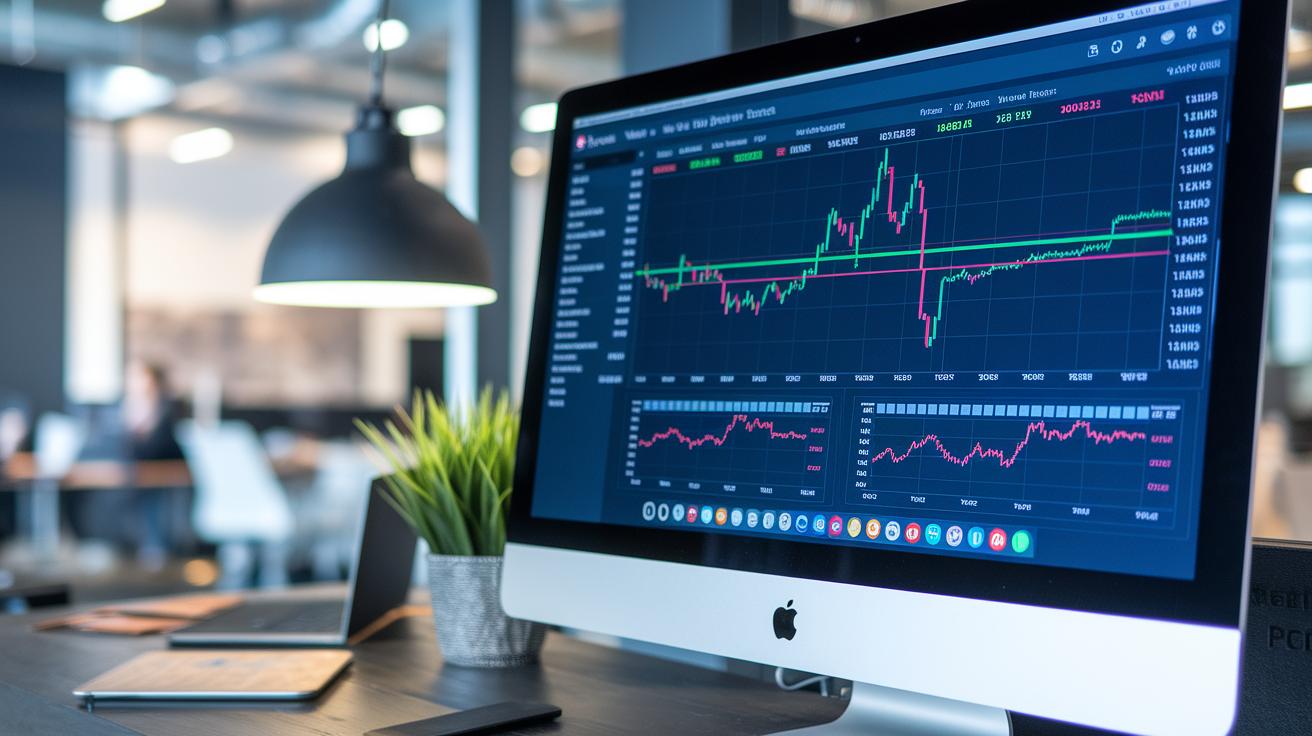
Have you ever wondered if you could get market info as fast as changes happen? The real-time market pulse dashboard gives you live updates and easy-to-understand insights on stocks, cryptocurrencies (digital currencies), and more.
It takes a flood of complex data and turns it into a clear view, so you can spot opportunities and handle risks almost immediately. You also get the power to customize alerts and filters, making sure you see exactly what you need.
It’s like having your own control panel that transforms a stream of numbers into smart, timely advice.
Key Features of a Real-Time Market Pulse Dashboard
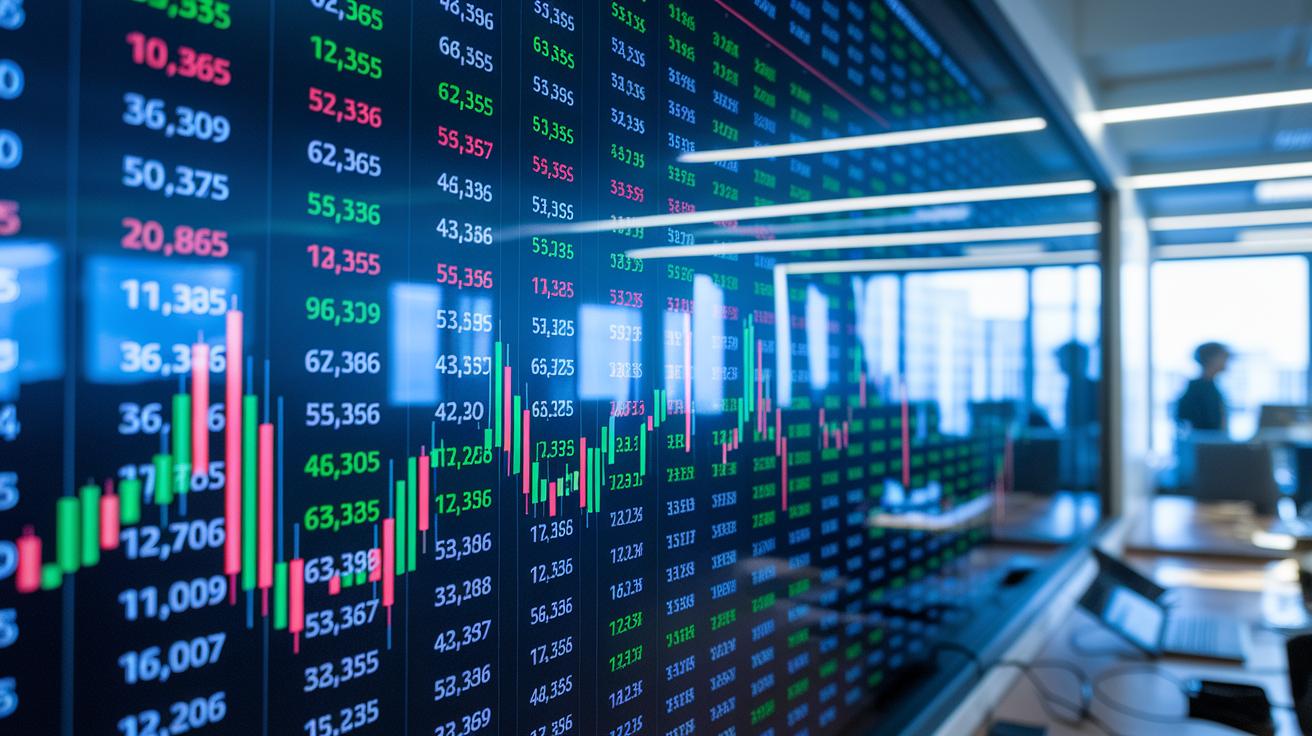
This dashboard pulls in data from top financial news sites, blogs, and market updates to offer quick, actionable insights. It takes in real-time information and skips the typical 15–20 minute delay, giving traders an almost immediate view of the market so they can stay ahead.
It comes with a live feed, customizable alerts, support for multiple assets, reduced latency, cross-platform syncing, and AI-driven summaries. You can set up your own profiles to track stocks, cryptocurrencies, and different sectors, making it easy to keep up with market changes. The system turns complicated financial data into clear, easy-to-understand analytics, acting like a live control panel that keeps pace with every market move.
Customization and Filtering Options for a Real-Time Market Pulse Dashboard
You can customize your market feed by filtering data by asset type, region, sector, or instrument. This setup keeps only the important market moves in view. You can even set alerts for price swings, volume spikes, or changes in market mood, turning a flood of data into a clear snapshot of what's really happening.
By focusing on the right time frame, asset details, and volatility, the dashboard sharpens your trading signals. For instance, if you look for short-term changes in a certain asset class, the system brings immediate opportunities and risks to your attention. Adjusting these settings gives you real-time alerts that are both clear and timely.
Personalized dashboards help you zero in on the parts of the market that matter most without being overwhelmed. With these adjustments, broad market data turns into a straightforward view of current asset performance. In short, these custom filters create a smart, real-time monitoring tool that supports quick and informed decision making.
Visual Design Best Practices for a Real-Time Market Pulse Dashboard

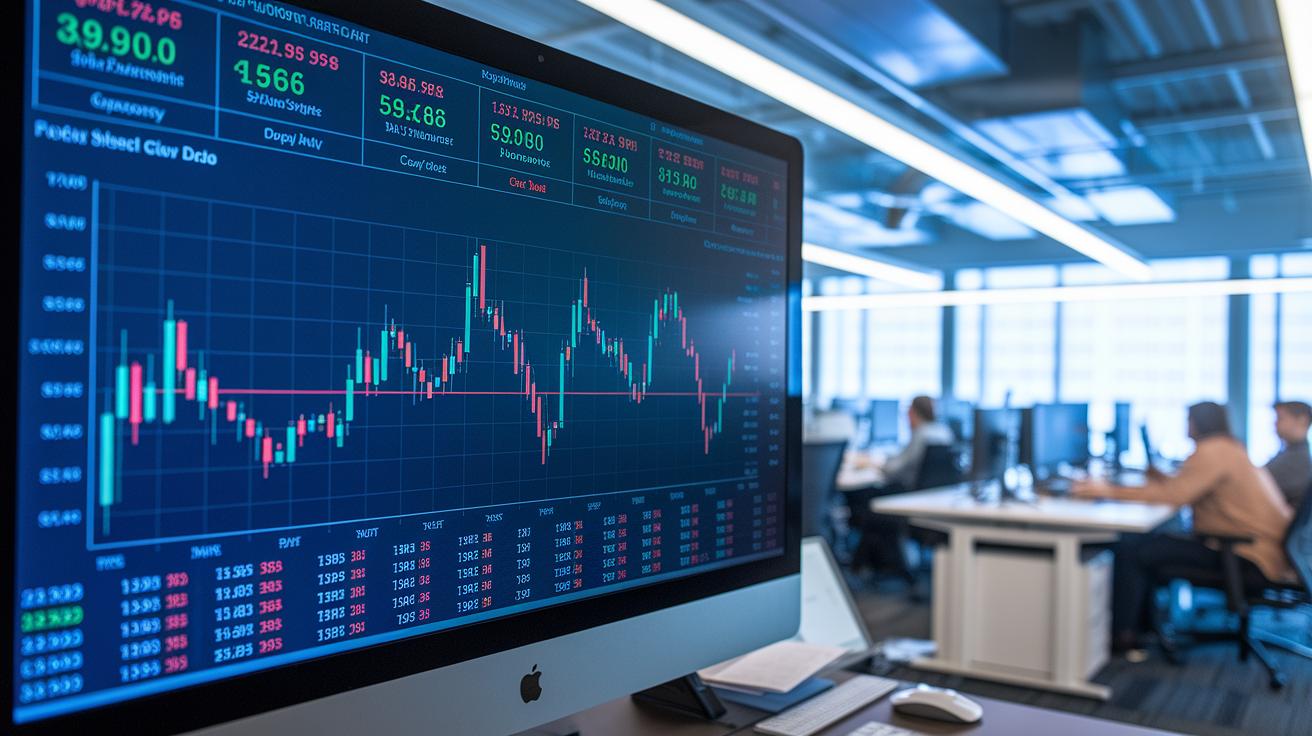
Start with a clear visual order that naturally guides the viewer’s eye. Arrange major elements like headlines, charts, and data tables in a thoughtful sequence. For instance, you might position your main headlines above interactive charts so users easily follow the flow of information.
Next, use strong color contrasts in your sentiment display modules. This means choosing colors that clearly show shifts in market mood. You know, cool colors can signal steady performance while warmer shades highlight dynamic changes. This way, trends like bullish signals and bearish trends stand out right away.
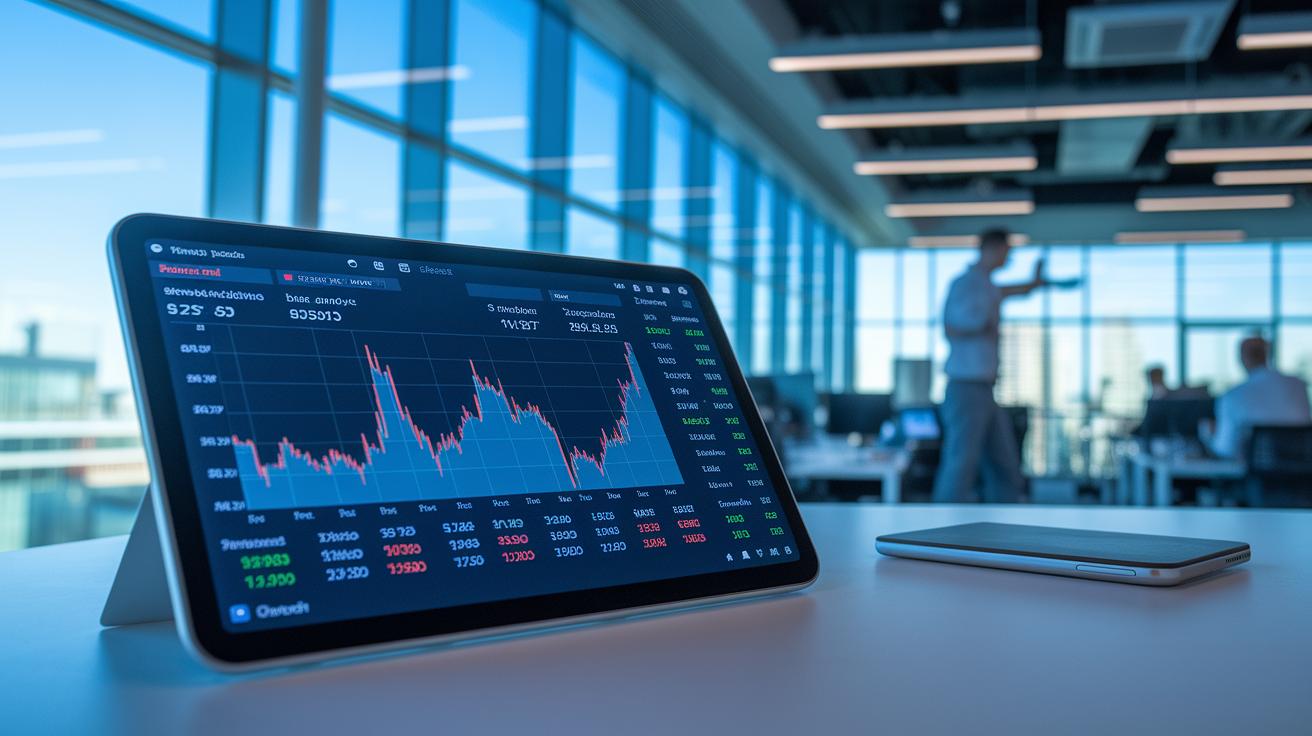
Also, consider using responsive widgets that adjust smoothly to different screen sizes. Think of these widgets as smart tools that offer up-to-date equity analysis, giving you a reliable snapshot of the market as conditions evolve.
Finally, enhance your dashboard with interactive trend overlays. Let users dive deeper into the data through clickable or hover-enabled graphs that reveal more detailed statistics. For example, a simple tap on a trend line might show you real-time price changes, blending intuitive design with informative insights.
Technical Architecture and Data Integration for a Real-Time Market Pulse Dashboard
Using Bright Data's web unlocker technology, the dashboard pulls in structured, real-time data to give you a clear look at market activity. It works like a human browsing the web, gathering updates through APIs (tools that let different software chat with each other), web scraping (automatically collecting data), and direct feeds from exchanges. In simple terms, it acts like an economic sensor that quickly picks up important financial signals.
Every part of the system gathers and organizes data from various streams. It works a lot like a trade volume reader or a market insight tool, turning raw numbers into clear, immediate analytics. This approach makes sure that market information flows smoothly, even when things are moving fast.
| Data Source | Integration Method | Latency | Reliability |
|---|---|---|---|
| News API | API Fetch | Low | High |
| Web Scraping | Automated Parsing | Very Low | Medium |
| Exchange Feed | Direct Connection | Minimal | High |
| Custom Unlocker | Human-like Simulation | Very Low | Very High |
Altogether, this unified system pulls data from a variety of formats and turns it into one clear market insight engine. Its parts convert raw signals into practical numbers, helping traders spot trends and keep an eye on shifts across different assets. With very low latency and high reliability, it bridges the gap between traditional market watching and modern digital analysis, so every piece of data helps you make smart, real-time decisions.
Ensuring Speed and Accuracy in a Real-Time Market Pulse Dashboard

Real-time processing helps traders avoid waiting 15 or 20 minutes for old data. It gives you a fast trends chart and a commodity flux tracker that update as the market changes. The design turns raw numbers into clear readings, so the trade performance meter stays in sync with fast-moving markets.
A side-by-side look shows that real-time systems work much better than older models. The system always checks for any missing info or unusual bumps in the data by using strict data-check routines. And when errors pop up, built-in fixes make sure the equity performance analyzer keeps up with today’s market trends. These actions greatly reduce the risk of outdated feeds and deliver a sharper picture when you’re making decisions.
By mixing these smart features together, the dashboard strikes a neat balance between speed and precision. Traders get instant access to key market signals, whether they’re watching a quick trends chart or checking the commodity flux tracker. In short, every piece, from the performance meter to the equity analyzer, offers real-time, accurate insights that help you stay ahead in the fast-paced market.
Key Use Cases for Investors and Traders in a Real-Time Market Pulse Dashboard

Day traders love this dashboard because it quickly flags key trading signals as they happen. For example, if you see a sudden dip or spike in the price, the trader performance board highlights it instantly, giving you a nudge to enter or exit a trade without missing the beat.
Portfolio managers also find the dashboard super handy. It displays clear portfolio analysis screens with rebalancing alerts and capital trend reports, making it easy to adjust your holdings on the fly. When the market shifts, you get timely notifications that help you tweak your positions and get the most out of every move.
Market analysts count on the real-time updates from the trader performance board to gauge the overall market mood. This immediate snapshot is crucial for spotting shifts and adapting strategies in real time.
And then there’s the sector-rotation feature. With dynamic market flow visualizers and detailed capital trend reports, the platform lets you see how different sectors are performing. It’s like having a front-row seat to the market’s rhythm, so you can fine-tune your approach and manage risk with confidence.
Scalability and Future Enhancements of a Real-Time Market Pulse Dashboard
We’re adding AI forecasting tools that work like a digital weather report for your money, helping you predict which way the market might move. The system uses auto-scaling technology, meaning it adjusts its resources on the fly whenever data increases. Plus, we’re expanding support to cover new types of assets. This update will turn the dashboard into a flexible tool that scans your financial landscape like a dynamic pulse-check. With crisp visual tools, spotting trends will be easier, making the interface feel like a live heartbeat of the market.
Looking ahead, our goal is to sharpen those AI insights even further. We’re fine-tuning our forecasting algorithms to grasp even the subtlest market ripples. By employing the latest, efficient techniques, the system will handle more data streams without slowing down. In short, these improvements will bolster the dashboard’s market rhythm analysis, allowing it to absorb fresh data types and meet ever-changing market demands, all while keeping accuracy and speed top of mind.
Final Words
In the action, our article reviewed the core features, customization options, design best practices, technical architecture, and speed benefits of a real-time market pulse dashboard. It showed how the tool condenses market data quickly and tailors insights by asset type for both diversified portfolios and focused strategies.
This guide encourages investors to refine their strategies and confidently discuss emerging trends. Embracing this innovative approach helps users make smart, timely decisions in today’s fast-moving financial world.
FAQ
What does a free real-time market pulse dashboard provide?
The free version of a real-time market pulse dashboard offers essential market updates and live data aggregation, giving traders quick insights into trending financial movements on a basic interface.
How does the real-time market pulse dashboard app work?
The real-time market pulse dashboard app gathers and displays market data instantly, allowing users to monitor stocks, cryptocurrencies, and sectors on mobile or desktop devices with an interactive interface.
What is Bookmap Market Pulse and how does it work?
Bookmap Market Pulse delivers a live visualization tool that shows market depth and trading activity. It processes real-time data to provide an interactive view that aids traders in evaluating price action.
What is the Market Pulse app?
The Market Pulse app aggregates real-time market information into a concise, customizable overview, enabling users to track key financial updates and trends for smarter, faster decision-making.
What features does the TTM Squeeze dashboard offer?
The TTM Squeeze dashboard identifies moments of low volatility and signals potential price breakouts, offering fast data analysis that helps traders spot actionable opportunities on live market movements.
What is Tos indicators login used for?
Tos indicators login provides access to a suite of custom trading tools and signals, allowing users to securely enter personalized dashboards that monitor live market trends and relevant financial metrics.
What is Pulse Trade?
Pulse Trade is a platform that integrates live market data and analytics for trade execution, helping traders make swift decisions by delivering an instant view of price changes and market trends.

